|
School Discipline in New London
Report Cover 
|
Table of Contents
I. Introduction II. Zero Tolerance III. School Discipline Policy Data: A Snapshot A. Arrests B. Referrals to the Juvenile Review Boards C. Suspensions IV. Conclusions and Promising Possibilities V. Recommendations VI. Note About Data Use Data Tables and Figures Table 1: Arrested Student Counts by District Table 2: Arrest Counts by School Table 3: Arrests by Race Table 4: Arrests by Special Education Status Table 5: Total Juvenile Review Boards Referrals Table 6: ISS and OSS by School Figure 1: ISS by School Figure 2: OSS by School Table 7: Incidents Leading to Suspension, by Year Figure 3: Incidents Leading to Suspension, by Year Appendices (click here, or see link above) |
I. Introduction
In January of this year the U.S. Department of Education (ED), in collaboration with the U.S. Department of Justice (DOJ), released school discipline guidelines that were meant to encourage school districts to review their discipline polices, in part, to reduce the number of suspensions and expulsions in schools. The goal is to keep students in a welcoming and safe learning environment in an effort to boost student’s academic success and close achievement gaps. The New London Public School (NLPS) District had embraced this initiative a year prior in its 2013-2016 Strategic Operating Plan. Strategic Operating Plan Goal #5 “Remove Barriers to High Performance” tackles this issue directly in strategy #3 which aims to “improve school climate where necessary through Positive Behavior Intervention and Supports (PBIS)” and strategy #4 which aims to “create program options to reduce the level of suspension and expulsion rates.” New London Parent Advocates (NLPA) were intrigued by this initiative, which prompted our organization to assess what the district has accomplished in this area and to assist the district with further implementation by offering recommendations to accomplish these goals.
NLPA examined New London’s Board of Education and school polices on suspension and expulsions, collected data from the State Department of Education, met with Superintendent of Schools, district Administrators, the School Resource Officer, spoke with parents, and researched zero tolerance policies as well as alternatives to those polices. Our goal was to gain a comprehensive picture of what the current policies are in New London, how administrators are enforcing them, and how parents and students are affected by them.
II. Zero Tolerance
Though the district does not explicitly use the term “zero tolerance”, it is implied by the structure and focus of district polices. Schools rely on discipline matrices to address behaviors based on a predetermined list of consequences. New London Public Schools are not alone in this approach; these types of policies have dominated school districts for decades. In recent years, especially, given high rates of suspension and expulsion and concerns about the school-to-prison pipeline, people across sectors have begun to ask questions about how effective these policies are in promoting school safety and academic achievement.
The American Psychological Association, for example, created a Zero Tolerance Task force, which submitted in 2006 a report examining the effectiveness of zero tolerance policies. (See Appendix A for a copy of the report.) The report describes “zero tolerance” as a “philosophy or policy that mandates the application of predetermined consequences, most often severe and punitive in nature, that are intended to be applied regardless of the gravity of the behavior, mitigating circumstances, or situational context.” The report then breaks down the ineffectiveness of the policies by showcasing flaws in the three essential arguments used to advocate for and defend the implementation of zero tolerance policies.
First, underlying zero tolerance policies is an assumption that the removal of a disruptive student will result in a safer environment for others. Long-term studies of zero tolerance policies, however, suggest the opposite. Schools with higher rates of suspensions and expulsions have less satisfactory school rankings, less satisfactory school governance structures and spend a disproportionate amount of time on disciplinary matters. Research also suggests a negative relationship between the use of school suspension and expulsions and gaps in academic achievement (even when controlling for demographics); in other words, if anything, zero tolerance policies appear to exacerbate, rather than improve, achievement gaps. Though it is not possible to claim causality, the research base challenges the idea that a zero tolerance approach creates a more positive school environment.
Second, the theory that swift and certain punishment serves as a behavior deterrent and improves behaviors overall represents the backbone of zero tolerance policies. The reality, however, is proving detrimental to our students. According the American Psychological Association Zero Tolerance Task Force, school suspension in general appears to predict higher rates of future misbehavior and higher amounts of future suspension for those who are suspended; in addition, school suspensions and expulsions are moderately associated with higher dropout rates and failure to graduate. Furthermore, increased reliance on harsher consequences has resulted in an increase in referrals to the juvenile justice system for matters that used to be handled by schools.
The third common argument for zero tolerance is that it removes subjective influence and that resulting policies are fairer to students. In reality, this is not the case. There continues to be a disproportionate number of students of color receiving punishments. African American students, for example, are consistently overrepresented among suspensions and expulsions, and African American students are disciplined more severely for less serious or more subjective reasons.
As a Turnaround-Alliance District, New London has taken steps to improve its overall ranking within the state. However, NLPS is currently still classified as a “failing” school district, has some of the highest suspension/expulsion and arrest rates in the state, and reports a graduation rate of approximately 65%. Based on the information shared above (about the research base), all of these issues could be reflective of our current zero tolerance discipline structure, and therefore it is important to take a closer look at that approach, its constituent policies, and their impact.
III. New London School Discipline Data: A Snapshot
A. Arrests
NLPS has one of the highest arrest rates in Connecticut and yet does not have an arrest policy, at least not a published version. We are told the district has a Memorandum of Agreement (MOA) with the Police Department, but that MOA was not provided, though it was requested. NLPA was told that only students who commit “illegal” acts are arrested; with arrest rates being what they are, this would lead one to believe that more “illegal” acts are committed in NLPS than elsewhere. NLPA set out to see how the number of arrests in our school district compares to that of other districts in our District Reference Groups (DRG), focusing on one DSG district with similar enrollment and one DSG district with significantly higher enrollment. Table 1 below offers a basic portrait of arrest rates in those two districts, Windham and Hartford, respectively.
Table 1: Arrested Student Counts for New London (NLPS), Hartford (HPS) and Windham (WPS)
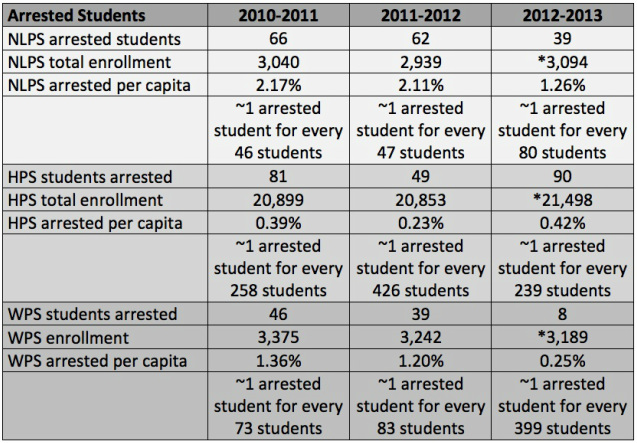
*estimates based on state data, calculating the maximum (5) for nine cells (NLPS), eight cells (HPS), and zero cells (WPS) with suppressed data due to 5 or fewer students enrolled at a given grade level in a given school
Table 2: Arrest Counts* by NLPS School
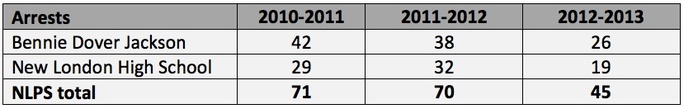
*arrest counts refer to the number of arrests and may be higher than the number of arrested students
As Table 1 shows, though the number of New London students arrested has decreased over the last 3 years, the percentage of arrested students per capita in the NLPS remains significantly higher than Hartford and Windham. And if we calculate just for middle and high school students, since those represent the only students subject to arrest, the problem becomes even more apparent: in 2012-13 alone, there was roughly 1 arrested student for every 39 middle and high school students. Of even greater distress is that of the 57% of all arrests made within the district over the three year period are from Bennie Jackson Dover Middle School; in other words, as Table 2 shows, more than half of all arrests involve middle school students. These rates of arrest are alarmingly higher than any middle school in Hartford or Windham.
Looking at the race of those arrested raises additional concerns. Table 3 below shows the disproportionate number of arrests of Black students in NLPS. Black students make up approximately 25% of the NLPS student body yet account for as much as 45% of the arrests in recent years. In 2012-13, the most recent year for which we have reliable data, the number of arrests has dropped significantly, and the counts seem to suggest less disproportionality in terms of Black students being over-represented among arrests. Further inquiry into this trend will be important, so we can understand what accounts for this promising shift.
Table 3: Arrests by Race
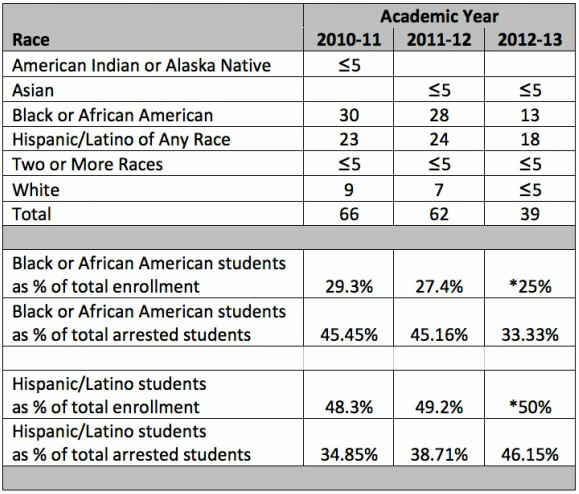
*estimates taken directly from NLPS Alliance application submitted to the CDE in August 2013; estimates also comport with recently released state data
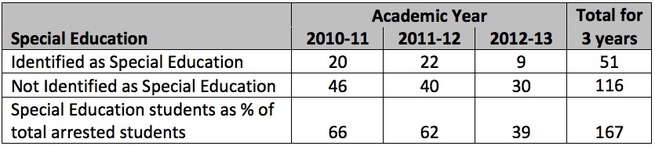
In addition to the disproportionate number of Black youth being arrested there is also a disproportionate number of Special Education students being arrested. According to analyses by the CSDE, approximately half of all student arrests statewide between 2011-2013 have been Special Education students. (See Appendix B.) As Table 4 below shows, in New London specifically, 51 of the 167 arrests for 2010-11, 2011-12, and 2012-13, or roughly 30% of all arrests over those three academic years, involved students who are classified as Special Education students, and who make up only 18% of the student population in the district and 18% of middle and high school students specifically.
Table 4: Arrests by Special Education Status
Table 4: Arrests by Special Education Status
Given these data, it seems evident that zero tolerance policies do not impact all students equally, do not result in more fairness, and do not remain free of subjective influence in New London.
B. Referrals to Juvenile Review Board
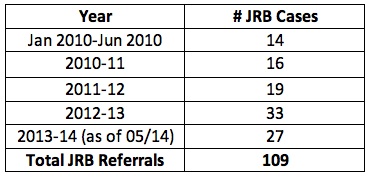
In 2010, New London Public Schools began utilizing a program called the Juvenile Review Board (JRB). Since then, students who are accused of offenses that the School Resource Officer (SRO) deems “arrest-able” can be referred to the JRB by the SRO. The JRB consists of a panel that includes the SRO, school administrators, school social workers, and Department of Children and Families (DCF) support staff. JRB members collectively review cases brought before them and administer consequences. Over the last four years 109 cases have been referred to the JRB. As Table 5 below shows, while the number of arrests has gone down in the district during this period, the number of JRB referrals has increased.
Table 5: Total JRB Referrals
Most cases referred to the JRB involve middle school and high school students, although a few do involve elementary school students. The largest number of referrals to JRB—56 referrals, or just over half of all referrals since 2010—originate in middle school, where there have also been the most arrests and, given the total number of enrolled students, the highest numbers of In-School Suspensions and Out of School Suspensions in the district, as which we address in the subsequent section.
The establishment of the JRB was meant to keep students out of the Juvenile Justice System; this reflects admirable intentions and represents an important step forward for the district. However, it is also important to note that students who are referred by the SRO to the JRB often receive and serve concurrent ISS and/or OSS for violating school policy. The high number of cases referred by the SRO to the JRB in the last four years, therefore, raises questions about whether the JRB has become an additional method for punishment rather than an alternative method for addressing “arrest-able” offenses and avoiding unnecessarily harsh consequences that bring long-term, negative ramifications for students’ growth, development, learning, and overall well-being.
The establishment of the JRB was meant to keep students out of the Juvenile Justice System; this reflects admirable intentions and represents an important step forward for the district. However, it is also important to note that students who are referred by the SRO to the JRB often receive and serve concurrent ISS and/or OSS for violating school policy. The high number of cases referred by the SRO to the JRB in the last four years, therefore, raises questions about whether the JRB has become an additional method for punishment rather than an alternative method for addressing “arrest-able” offenses and avoiding unnecessarily harsh consequences that bring long-term, negative ramifications for students’ growth, development, learning, and overall well-being.
C. Suspensions
The Connecticut Department of Education presented a report on June 13, 2013 regarding suspensions and expulsions in Connecticut. (See Appendix B for a copy of the report.) The report highlighted trends in suspension and expulsion rates since the implementation of Connecticut General Statutes Section 10-233c, created in 2008 and revised in 2010. Section 10-233c aimed to lower the number of students who receive suspensions. The law is meant to urge administrators to think carefully about their decisions and to find ways to keep students connected to school by placing them in programs that will keep them learning, while still holding them accountable for improper behavior. The law, in part, reads:
"Suspensions pursuant to this section shall be in-school suspensions, unless during the hearing held pursuant to subsection (a) of this section, (1) the administration determines that the pupil being suspended poses such a danger to persons or property or such a disruption of the educational process that the pupil shall be excluded from school during the period of suspension, or (2) the administration determines that an out-of-school suspension is appropriate for such pupil based on evidence of (A) previous disciplinary problems that have led to suspensions or expulsion of such pupil, and (B) efforts by the administration to address such disciplinary problems through means other than out-of school suspension or expulsion, including positive behavioral support strategies."
Since its implementation, the total number of In-School Suspensions (ISS), Out-of-School Suspensions (OSS) and Expulsions statewide has decreased by about 14% from 2007-2012. The total number of OSS, specifically, has decreased by about 39% in the same period. Conversely, the number of ISS has increased by over 8%.
How does NLPS compare to the state? According to the state’s report NLPS ranks 5th highest in the state for the rate of suspension/expulsion in middle school and 13th highest for high school. Notably, the entities with the top 4 highest rates of suspension/expulsion for middle schools—the only entities that rank higher than NLPS—include three charter school organizations (Achievement First Hartford Academy Inc., Bridgeport Achievement First, and Amistad Academy District) and Unified School District #2, which serves students who reside and receive education in Department of Children and Families (DCF) facilities, and who have been placed by DCF in private residential facilities, psychiatric hospitals, or RESC residential programs. In addition, NLPS’s rate for suspension/expulsion at the middle school level is 10 percentage points higher than the next ranked regular public school district (i.e., East Hartford Public Schools, ranked 7th).
The New London Board of Education District Policy Number 5114, last revised in 2010, consists of an outline highlighting prohibited and punishable conduct, which could result in suspension or expulsion. (See Appendix C for a copy of this policy.) The new Connecticut Department of Education revisions, referenced above, do not appear to be addressed anywhere in the New London Board of Education policy. In the three years since 2010, the number of suspensions in the district has remained high: 1656 in 2010-11, 1517 in 2011-12, and 1705 in 2012-13. To put these numbers in perspective, it might help to consider that when looking across Windham and Hartford together, there was roughly 1 suspension for every 4 or 5 students in 2011-12, compared to 1 suspension for every 2 students in New London during for that same year.
That said, New London has evidently taken initiative over the last few years to decrease the number of out-of-school suspensions in middle and high school. Table 6 below shows the number of ISS and OSS per school over the last three years. As indicated in our “Note about Data Use,” where we explain our rationale for relying primarily on state-provided data, some suspension counts in the table below differ markedly from those in district-provided data. In the case of NLPS elementary schools especially, differences are rather large—for example, state-provided data indicate no suspensions at Jennings in 2010-11 or 2011-12 compared to 31 OSS and 45 ISS in 2010-11 and 43 OSS and 74 ISS in 2011-12 indicated by the district. For these reasons, our analyses utilize state-provided data only, and include district-provided data as an appendix. (See Appendix D.)
Table 6: ISS and OSS by School
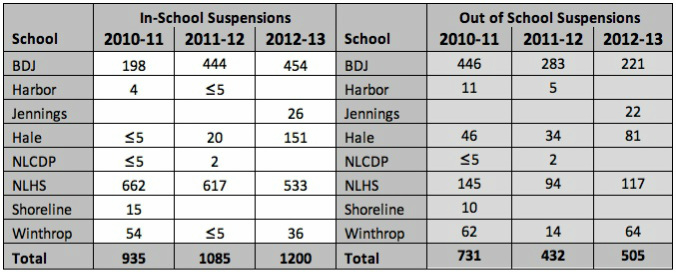
* these are counts of suspensions issued, not individual students
Figure 1 and Figure 2 below present the data above in bar graph form, helping to illustrate a few key points of interest. New London High School decreased both its ISS and OSS by approximately 20% in the three-year period. Bennie Dover Jackson Middle School decreased its number of OSS by approximately 50% over the three-year period, but increased its number of ISS by 44%. Because state-provided and district-provided counts for elementary schools vary markedly, we refrain from addressing specific school-level trends except to say that the number of ISS and OSS at the elementary school level appear to be high and/or on the rise, even in the primary grades, and that various concerns warrant further examination. For example, a close look at 2012-13 state-provided data indicates between 1 and 5 ISS at every grade level (1-5) at Jennings (where Latino students received all reported ISS for grades 1-4, and were also among those receiving ISS in grade 5) and Hale (where 18 ISS were reported in grade 2).
Figure 1: ISS by school
Figure 1: ISS by school
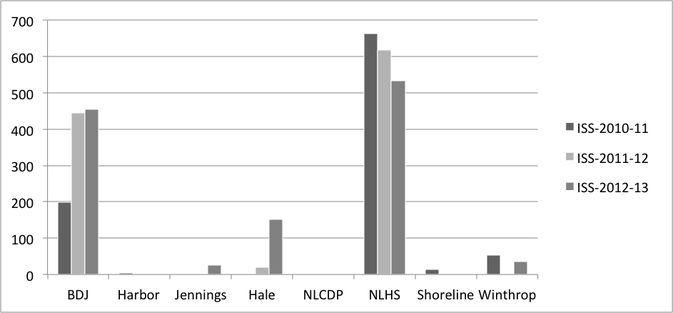
Figure 2: OSS by school
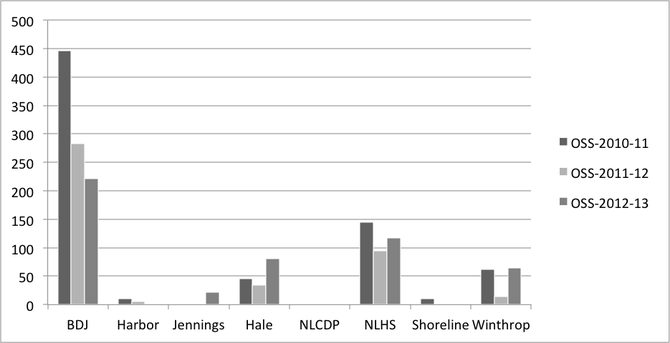
A close look also indicates that in 2012-13 Special Education students were among those receiving ISS at multiple grade levels at Jennings (1, 4, 5, KF), at all grade levels at Hale (1, 2, 3, 4, 5), and at three grade levels at Winthrop (3, 4, 5). Concerning OSS, the situation appears similar. Jennings, Hale and Winthrop all have what look to be mostly Latino and Black youth receiving OSS, and at least some Special Education students represented among those receiving OSS at multiple grade levels at Jennings (2, 4, 5), Hale (1, 2, 3, 4, 5) and Winthrop (1, 2, 3, 4). (And again, for these elementary schools state-provided suspension counts—those reported above—are generally significantly lower than the counts provided by the district.)
Given the number of suspensions within the district, a logical question might be: What incidents are causing students to be suspended? Table 7 presents a breakdown of suspensions by incident and by school year. Figure 3 provides a graphic representation of that same data.
Table 7: Incidents leading to suspension, by year
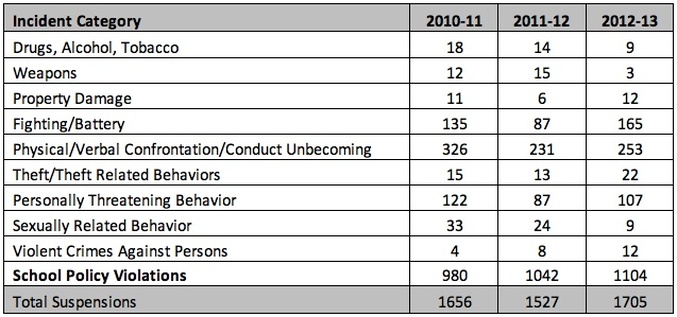
Figure 3: Incidents leading to suspension, by year
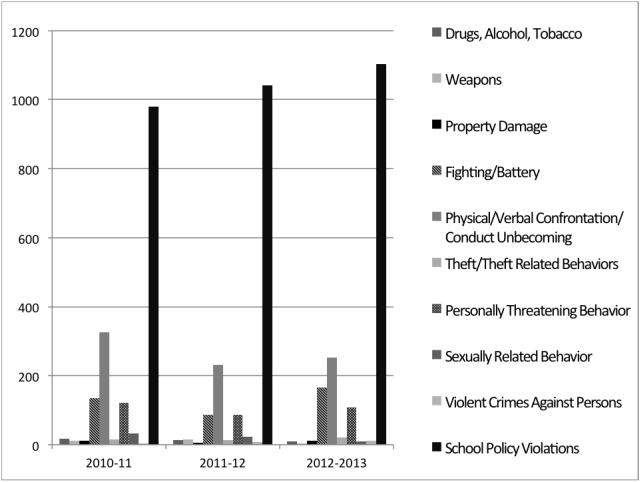
As the Table 7 and Figure 3 indicate, of the increasingly large number of suspensions within the district, 60-65% of all suspensions are due to School Policy Violations. Physical/Verbal Confrontation/Conduct Unbecoming account for 15% of suspensions. Fighting/Battery account for 10% of suspensions. Violent Crime, Drugs, Alcohol, Tobacco, Weapons make up only 1-2% of all suspensions in the district. To be clear, these percentages refer to incidents, not “offenders,” and thus do not account for duplicate “offenders,” students who receive multiple suspensions in a given year; they account for the total number of suspensions issued in a given year.
To put the number of suspensions in perspective, Hartford and Windham, districts in our DRG and Alliance Districts, together serve a population of around 24,000 students and issue approximately 7000 total suspensions a year (ISS and OSS). As mentioned above, that translates to roughly 1 suspension for every 4 or 5 students, whereas in New London has a population of about 3000 and issues approximately 1500 suspension per year, which translates to roughly 1 suspension for every 2 students. Also consider 8.6% of students statewide received at least one suspension or expulsion in 2011-12 compared to 41.1% of students in middle school in New London and 27.8% of students in high school in New London. From the standpoint of missed school days, this becomes even more concerning when taking into account that a student who is sanctioned receives, on average, 2.5 sanctions in a year, and that as of 2010-11, the average number of days sanctioned was 5.5 in New London compared to the state average of 3 days in that same year. This has significant implications for attendance, achievement, and graduation.
To put the number of suspensions in perspective, Hartford and Windham, districts in our DRG and Alliance Districts, together serve a population of around 24,000 students and issue approximately 7000 total suspensions a year (ISS and OSS). As mentioned above, that translates to roughly 1 suspension for every 4 or 5 students, whereas in New London has a population of about 3000 and issues approximately 1500 suspension per year, which translates to roughly 1 suspension for every 2 students. Also consider 8.6% of students statewide received at least one suspension or expulsion in 2011-12 compared to 41.1% of students in middle school in New London and 27.8% of students in high school in New London. From the standpoint of missed school days, this becomes even more concerning when taking into account that a student who is sanctioned receives, on average, 2.5 sanctions in a year, and that as of 2010-11, the average number of days sanctioned was 5.5 in New London compared to the state average of 3 days in that same year. This has significant implications for attendance, achievement, and graduation.
IV. Conclusions and Promising Possibilities
It is clear that New London needs to address its discipline policies and outcomes, not only to comply with its own Strategic Operating Plan and with federal guidelines, but to reduce the clear, negative impact that the zero tolerance approach and current policies are having on our students. What might these alternatives be?
In their 2006 report, the American Psychological Association Task Force concluded that there are disciplinary alternatives that could make a stronger contribution toward maintaining school safety and the integrity of the learning environment while keeping a greater number of students in school. Effective alternatives must include the following three levels of intervention: primary prevention strategies (targeted at all students), secondary prevention strategies (targeted at those students who may be at risk for violence or disruption), and tertiary strategies targeted at those students who have already engaged in disruptive or violent behavior. Indeed, emphasizing prevention seems to be a surefire method for reducing the need to apply consequences.
Restorative justice approaches represent particularly promising alternatives to a punishment-focused system. Restorative justice that have gained momentum in recent years, after bringing about dramatic improvements rates of suspension and expulsion, as well as improvements in overall school climate, attendance, and achievement, in a number of urban school districts. (See Appendix E for some examples of research outcomes highlighted by the federal government.)
Restorative Justice acknowledges and reinforces good, community-minded behavior as much as it reacts to misbehavior. When students break rules, they are held accountable and presented opportunities to ‘make things right’—in other words, to restore justice to a situation that is somehow unjust. These situations are seen as opportunities to learn and grow, rather than to punish, and as a result they provide opportunities to strengthen community and especially the relationships among students, teachers and parents. Madison and Bridgeport schools are currently in the early stages of implementing restorative approaches, following the examples of cities like Denver, San Francisco, Oakland, West Palm Beach and so on. (See Appendix F for some additional resources related to restorative justice programs and outcomes.)
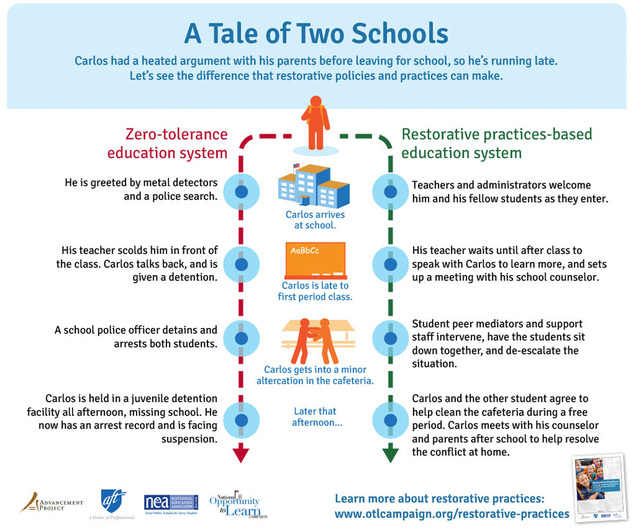
This recent graphic from the Opportunity to Learn Campaign illustrates the difference between a zero tolerance system and one grounded in restorative justice.
Restorative Justice approaches present a particularly powerful alternative for New London Public Schools, where large numbers of suspensions are not due to fighting or weapons but to “school policy violations,” which are by definition not the things that most people think of when they think of what would warrant 'removal' from school. “School policy violations” should be the easiest violations for schools to resolve by a) working in consultation with students, parents and community members to revisit and revise school policies, and to reduce their necessarily punitive nature (because clearly policies that lead to so many suspensions are not working for our young people), and b) implementing a restorative justice approach that offers students a process by which to 'make things right' with the school community when they violate a policy that is recognized to be of value to that community (i.e., to school staff, students and community members).
Arguably the hardest parts of a restorative justice approach involve situations where young people have seriously injured one another (whether physically, emotionally, etc.) and where everyone has to work together to find ways for meaningful 'repair' of that harm; such situations often require counseling and intensive human work. “School policy violations” are arguably less challenging in certain ways and therefore represent a particularly promising place for our local schools to start making progress toward fewer suspensions and more inclusive, responsive, and safe learning conditions for all students. More specific related recommendations are included below.
Arguably the hardest parts of a restorative justice approach involve situations where young people have seriously injured one another (whether physically, emotionally, etc.) and where everyone has to work together to find ways for meaningful 'repair' of that harm; such situations often require counseling and intensive human work. “School policy violations” are arguably less challenging in certain ways and therefore represent a particularly promising place for our local schools to start making progress toward fewer suspensions and more inclusive, responsive, and safe learning conditions for all students. More specific related recommendations are included below.
V. Recommendations
Based on what we have learned about school discipline policies and outcomes in our district, New London Parent Advocates present to the Board of Education the following recommendations:
Based on what we have learned about school discipline policies and outcomes in our district, New London Parent Advocates present to the Board of Education the following recommendations:
- Review existing discipline policies to ensure they are appropriate, effective, and in line with the current state law and federal guidelines; monitor implementation to ensure fair and equitable administration of the codes.
- Place a moratorium on suspensions at the elementary school level, mandate a significant reduction in Out-of-School and In-School Suspensions at the middle school and high school level, and reduce all suspensions to 5 days or fewer, rather than 10 days or fewer (in all but extreme situations), so that students miss less instructional time and spend less time out of school, where they are often unsupervised.
- To protect against punishment and/or exclusion of students for mental health issues and related behavioral challenges, ensure that mental health services and training are available for all school staff, and that appropriate mental health resources are available for students.
- Ensure that when In-School Suspensions (ISS, ADP, PRR) are issued those consequences are coupled with positive behavior supports and interventions, such as counseling, responsive behavior modification classes, and so on.
- Develop a comprehensive staged plan for implementing district-wide alternative discipline approaches grounded in restorative justice.
- Engage teachers, parents, students, community members and other stakeholders in developing alternative discipline approaches, grounded in restorative justice, some of which can be put in place immediately to reduce the number of arrests and the number of days that students spend removed from the learning environment.
- 6a. Consider starting with alternative, restorative approaches to addressing “school policy violations."
- Allocate resources to support and implement alternative discipline approaches grounded in restorative justice; ensure that ongoing professional development related to restorative justice, as well as cultural relevancy and responsiveness, is available for teachers, administrators and other school staff.
- 7a. Consider building on and extending existing partnerships that align with restorative justice approaches (e.g., Violence Is Preventable (VIP) and Healthy Relationships programming already offered by Safe Futures).
- Deepen the partnership with the Juvenile Review Boards in order to continue diverting students away from the Juvenile Justice System, while also ensuring that referrals to the JRB are appropriate, just, and equitable, and while collaborating with the JRB to implement a restorative justice approach district-wide.
- Continually monitor the district’s progress on eliminating or reducing out-of-school suspensions, and make suspension, expulsion and arrest data available online for parents, school board members, and other community members to review on a quarterly or annual basis..
- 9a. Consider having School Governance Councils review and monitor this information yearly to support compliance.
- 9b. Consider establishing a committee of parents, students, administrators, and other community representatives to examine these policies in order to review and revise them as needed.
- Resolve discrepancies between state-provided data, which should reflect reports submitted by NLPS to the state, and district-provided data so that reliable research can be conducted and utilized to ensure justice and enhance teaching, learning, and collaboration in the district and the community.
VI. Note about Data Use
NLPA began its research by collecting data from the Connecticut State Department of Education (CSDE) Bureau of Data Collection, Research and Evaluation. We made our initial request on March 5, 2014. We received an immediate response from Ms. Gambaccini-May, who is the contact for Suspension and Expulsion Data Analysis, and we received requested data six days later on March 11, 2014. NLPA moved forward in analyzing this state-provided data, as well as additional data available via state databases, and NLPA drew upon information from these state reports when members met with NLPS administration at a meeting on April 22, 2014. At that time Dr. Fisher questioned the information we presented, which we explained was provided to us by a representative of the CSDE. We then invited Dr. Fischer to forward any additional data or information, which we formally requested on May 15, 2014. In subsequent weeks, NLPA received some responses, including some data, from NLPS/Dr. Fischer. The most pertinent and comprehensive data were provided on June 6, 2014 and June 17, 2014, 22 days after the initial request and 7 days after this report was already drafted using state-provided data. NLPA recognized immediately that there were discrepancies between the state-provided used in the report and the data provided by the district. In light of those discrepancies, NLPA opted to include district-provided data as an appendix (Appendix D), but to maintain the report’s primary reliance on state-provided data (except in a few named areas).
This decision was made for the following reasons: 1) using only one set of data, rather than conflicting datasets, ensures more clarity in reporting and less confusion for the reader; 2) state-provided data are based on mandated reporting by school districts, including NLPS, to the state; 3) state-provided data are the basis for state-level analyses, as well as policy-pertinent, third-party analyses (e.g., analyses by organizations like CT Voices for Children); and 4) state-provided data appear to reflect counts that are, if anything, lower than those in the district-provided data, and thus the analyses in this report are able to underscore the severity of the issue, even using the most conservative numbers available.
In sum, all analyses in this report rely on data provided to NLPA by Ms. Gambaccini-May, who is the contact for Suspension and Expulsion Data Analysis at the CSDE Bureau of Data Collection, Research and Evaluation, and/or data downloaded from the CSDE via Connecticut Education Data and Research (CEDaR) search engines.
